M&M reporting:
Kodin Kuvalehti on suomalaisten mielestä kaikkein arvostetuin naistenlehtibrändi. Toiseksi arvostetuin on Kauneus&Terveys ja kolmanneksi arvostetuin Kotiliesi.
Kodin Kuvalehdellä on myös Suomen suurin levikki. Levikintarkastus Oy:n mukaan lehdellä oli viime vuonna 168 502 tilaajaa.
Irtonumeromyyntimarkkinoita hallitsevat Cosmopolitan (irtonumeromyynti 28 070 kappaletta vuonna 2011) ja Me Naiset (24 307) jäävät arvostuksessa selvästi kärkikolmikon taakse.
Tiedot perustuvat Taloustutkimuksen ja Markkinointi&Mainonta-lehden "Brändien arvostus 2012" -tutkimukseen. Tutkimuksessa selvitettiin 1090 brändin arvostus suomalaisten keskuudessa.http://www.marmai.fi/uutiset/cosmopolitan+ja+me+naiset+pyh+kodin+kuvalehti+on+arvostetuin/a2156699
Thursday, November 22, 2012
Guardian mobile visits overtake desktop at some times of day
thequardian reporting:
"Mobile is having a huge transformational effect not only on how our audience seek out content, but how they're discovering it," says Anthony Sullivan, group product manager for Guardian Core products at Guardian News & Media.
Sullivan was speaking at the Guardian Mobile Business Summit 2012 conference in London, where he provided some stats on how people are accessing Guardian products – its website, mobile website and native apps – on mobile phones and tablets.
"The way we've organised ourselves reflects that we put mobile really at the centre of our planning," said Sullivan, revealing that at the start of 2011, mobile devices accounted for just over 10% of visits to core Guardian products, but less than two years later, that's closer to 30%.
"That's just mobile handsets," added Sullivan. "Once you add tablets on top, that jumps to closer to 35%, and it's in tablets we're seeing the most rapid growth at the moment."
Sullivan said that 94% of tablet visits to Guardian products are on Apple's iPad, but that he expects this to change "pretty quickly" in the months ahead, thanks to the release of new, high-profile Android and Windows 8 tablets.
http://www.guardian.co.uk/media/appsblog/2012/nov/19/guardian-mobile-tablet-growth?utm_source=Daily+Buzz+from+eMedia+Vitals&utm_campaign=025e615e53-nl_DB_11_20_2012&utm_medium=email
On Edge: The Next Generation Explained
MarketingDaily reporting:
We’ve been through Baby
Boomers, Generation X,
Generation Y/Millennials.
Now it’s time to get ready
for “Generation Edge.”
The term, as designated by brand consultancy The Sound Research, refers to consumers born after 1995,
many of whom are just moving into adulthood this year. Having grown up amid a series of foundation-shattering crises (among them September 11, wars in Afghanistan and Iraq, and the financial collapse of 2008), Generation Edge is less entitled than their predecessors, the Millennials.
“What we’ve seen is that they’re very, very different from Millennials,” Ian Pierpoint, global
president at The Sound Research, tells Marketing Daily. “Firstly, their parents and the influence
their parents had on them. Millennials were raised by Boomer parents. These guys have been
brought up by Generation X, who were and remain cynical, rebellious and want to do things their
own way.”
Having lived through a global recession and no guarantee of higher education, Generation Edge understands that things in life will not come easily, Pierpoint says. Rather, they understand success is not guaranteed and do not take accomplishments for granted. Rather, they are more defined by their ability to roll with the punches, he says.
“Because of the way their parents have brought them up, they’ve got a bit of an edge,” Pierpoint says. “Millennials were not rebellious; they’re extremely conformist. Generation Edge want to cut their own path in life.”
http://www.mediapost.com/publications/article/187543/on-edge-the-next-generation-explained.html?edition=53704#axzz2Cx6ikOS6
Wednesday, November 21, 2012
Hyperlocal Video Finally Comes of Age
Street Fight reporting:
Hyperlocal video has, until now, been basically an oxymoron. The local television stations push out a decent amount of video but it has a metro rather than a hyperlocal focus. Patch.com and other hyperlocal news networks have done a bit of video, but it remains expensive to produce and comparatively hard to monetize at lower traffic levels. Even as small businesses increasingly embrace social media marketing and, to a lesser degree, online text and display ads, you don’t see a lot of mom-and-pop stores doing DIY video ad placements. Likewise, there are a wide variety of video ad networks but those have largely failed to penetrate down to the hyperlocal level — except for wide-scale networks that primarily dump remnant ads on less-trafficked hyperlocal videos.Which is why a platform like Glocal looks really, really interesting. The Ann Arbor, Michigan video scraping and curation startup has some pretty nifty technology that allows users to drill down to find video content close to where they live. The U.S. map allows users to quickly zoom in and out of local and regional video collections. At this point, there really isn’t enough truly hyperlocal video content to make a platform like Glocal interesting. A drill-down into the San Francisco area reveals only a handful of videos on offer and none that are truly hyperlocal. But the company is skating to the opportunity space ahead of the puck.
http://streetfightmag.com/2012/11/21/hyperlocal-video-finally-coming-of-age/#.UKzt1oXXrRs
Take a Broader View Of Agile To Survive In The Digital Age
Forrester reporting:
finished analyzing our 2012 State Of EA survey, were we asked a number of questions at the end of the survey on how firm’s identify and introduce new technology - new technology that your firm is counting on for innovation and competitive advantage. The results underscore a conviction that is growing in me: IT’s “one size fits all” approach to standardizing everything, and general aversion to risk isn't cutting the mustard. Simply put, opportunities for competitive advantage through technology fueled disruption get missed and this means digital extinction. Some data from our survey of 207 enterprise architects:
We think agile development practices are not enough, however. In the words of one executive we spoke with, a process for identifying, selecting and getting funding for emerging technology is lacking. We find that most firms lump emerging technology into the same pipeline with everything else, and this causes the lost opportunities due to ponderous planning, rigid standards, and low risk tolerance...
http://blogs.forrester.com/brian_hopkins/12-11-20-take_a_broader_view_of_agile_to_survive_in_the_digital_age?utm_source=Daily+Buzz+from+eMedia+Vitals&utm_campaign=31c48d5c36-nl_DB_11_21_2012&utm_medium=email
finished analyzing our 2012 State Of EA survey, were we asked a number of questions at the end of the survey on how firm’s identify and introduce new technology - new technology that your firm is counting on for innovation and competitive advantage. The results underscore a conviction that is growing in me: IT’s “one size fits all” approach to standardizing everything, and general aversion to risk isn't cutting the mustard. Simply put, opportunities for competitive advantage through technology fueled disruption get missed and this means digital extinction. Some data from our survey of 207 enterprise architects:
- 58% reported that sales and marketing is in the top five most likely organizations to deliver technology innovations, and they are chasing windows of opportunity that close in months. IT typically takes at least a year to do anything.
- 52% say there is at least some business dissatisfaction with the level of new technology introduction. The top reason, given by 78% of respondents, is that IT is too slow.
- 70% of firms admit to having trouble reacting to disruptions caused by emerging technology, and 60% admit to difficulty reacting to change in general.
We think agile development practices are not enough, however. In the words of one executive we spoke with, a process for identifying, selecting and getting funding for emerging technology is lacking. We find that most firms lump emerging technology into the same pipeline with everything else, and this causes the lost opportunities due to ponderous planning, rigid standards, and low risk tolerance...
http://blogs.forrester.com/brian_hopkins/12-11-20-take_a_broader_view_of_agile_to_survive_in_the_digital_age?utm_source=Daily+Buzz+from+eMedia+Vitals&utm_campaign=31c48d5c36-nl_DB_11_21_2012&utm_medium=email
Debate Club: Direct or Brand Ads on The Third Screen?
Digiday reporting:
The shift to mobile is happening. The problem: small screens leave little room for great creative and fat fingers push up click-through rates. We asked speakers at the Digiday Mobile conference on Dec. 13 to pick a side, is mobile media better suited for brand advertising or direct, and why?
Based on today’s display standards, we are still seeing more direct-response work in the mobile industry than brand advertising. However, a lot of mobile advertising remains interruptive and distracts from a user’s primary intent. Given the highly personal nature of mobile devices, advertisers should develop richer brand advertising that creates emotional connections through service and utility.
—Jonathan Greene, managing director of mobile and social platforms, R/GA
The mobile medium is great for brand advertising within news and other editorial content. Readers are deeply engaged with what they’re reading — and the advertising that accompanies it — on a mobile screen. Brand advertising can be targeted and can be effective when it gracefully interrupts the user’s reading experience as a full-page ad in a magazine does. Plus, sponsor content is a very promising brand-advertising format on mobile and tablet.
—Kevin Delaney, editor-in-chief, Quartz....
http://www.digiday.com/platforms/debate-club-direct-or-brand-ads-on-the-third-screen/?utm_source=Daily+Buzz+from+eMedia+Vitals&utm_campaign=31c48d5c36-nl_DB_11_21_2012&utm_medium=email
Sunday, November 18, 2012
Tablet and print magazines are ‘working in combination’, claims trade body
TabTimes reporting:
The Tablets and Publishing (TAP) report
sees the UK-based PPA draw on both internal market research as well as
handful of international studies, and states that 96% of tablet owners
have read a printed magazine in the last year, compared to the national
average of 80%.
And while this perhaps merely backs up other reports that tablet owners now read more, the report indicates that readers “continue to want both formats”, with tablets in particular making readers more open to trying new brands.
"There is a strong link between tablet owners and magazine readership,” said Marius Cloete, head of research at the PPA.
"A number of studies suggest that digital editions are reinvigorating the appetite for magazine media and this has been confirmed by our own research with Tolunaquick, which demonstrates that digital editions are not eroding the market for print editions, instead quite the opposite.
"Tablet owners are more likely to have read and purchased printed magazines in the previous three months than the national average, dispelling the myth that tablet owners are abandoning print in favour of digital. The two platforms instead appear to be working in combination to expand consumers' reading repertoire".
Elsewhere in the report, the PPA highlights earlier research from GFK that magazine ads deliver slightly better levels of recall on the tablet (56%) than on print (53%), and puts forward that the magazine market can, thanks to tablets, continue to look forward to a bright future going forward
http://tabtimes.com/news/media/2012/11/13/tablet-and-print-magazines-are-working-combination-claims-trade-body
New
research from the Professional Publishers Association (PPA) puts a
positive spin on how tablet editions are helping magazine publishers
that are struggling with falling print circulation.
And while this perhaps merely backs up other reports that tablet owners now read more, the report indicates that readers “continue to want both formats”, with tablets in particular making readers more open to trying new brands.
"There is a strong link between tablet owners and magazine readership,” said Marius Cloete, head of research at the PPA.
"A number of studies suggest that digital editions are reinvigorating the appetite for magazine media and this has been confirmed by our own research with Tolunaquick, which demonstrates that digital editions are not eroding the market for print editions, instead quite the opposite.
"Tablet owners are more likely to have read and purchased printed magazines in the previous three months than the national average, dispelling the myth that tablet owners are abandoning print in favour of digital. The two platforms instead appear to be working in combination to expand consumers' reading repertoire".
Elsewhere in the report, the PPA highlights earlier research from GFK that magazine ads deliver slightly better levels of recall on the tablet (56%) than on print (53%), and puts forward that the magazine market can, thanks to tablets, continue to look forward to a bright future going forward
http://tabtimes.com/news/media/2012/11/13/tablet-and-print-magazines-are-working-combination-claims-trade-body
Saturday, November 17, 2012
People Magazine Launches Custom Social Platform
Folio reporting:
As more and more women turn to social media for information and interaction, so is People magazine. The Time Inc. title has launched “Your Turn” within its website—its own social platform that allows users to contribute to and share with People.com.
By visiting YourTurn.People.com users can upload photos for various “challenges” that are tied to engaging news or trending topics on the site. To participate, a user shares images from Facebook, Twitter, Instagram or a desktop computer. Submissions are also collected from different social networks by using a People.com determined hash tag that coincides with a specific challenge.
“We’ve been collecting user photos over the past few years—we’ve offered a lot of different challenges for readers, from Halloween to show us your cute pets,” says Janice Morris, managing editor for People Digital. “But we never had one place to house all the images and we never did it consistently, instead treating it as a special event. We wanted to give readers more of a turnkey platform to work with because it’s so easy to upload now with all the social tools, and hash tags make it easy to share and communicate.”
To take advantage of the presidential election buzz, for example, People asked readers to share pictures of themselves voting. Using the hash tag #YTIVoted, users could tweet or use Instagram to share their images with the magazine, which were then uploaded to this social platform in the “Share Your Voting Pics” challenge section. Morris says the brand hopes to roll out a new challenge everyday, though testing is still taking place to determine the best frequency.
http://www.foliomag.com/2012/people-magazine-launches-custom-social-platform?utm_source=Daily+Buzz+from+eMedia+Vitals&utm_campaign=1f6768aede-nl_DB_11_16_2012&utm_medium=email#.UKelTYXXrRs
New Survey Supports That Ebook Borrowers Buy, Too
digitalbookwire reporting:
Readers who borrow ebooks from libraries also buy books at an impressive clip — and their buying has accelerated, according to a new survey.
An online poll of 75,000 library patrons conducted by Cleveland-based library lending platform OverDrive and the American Library Association found that those who borrow ebooks also buy about 3.2 print books and ebooks per month. Further, 44% of survey respondents reported that their digital content purchases have increased over the past six months.
The finding supports that of a study from earlier in the year from the Pew Internet and American Life project which found that among those who borrow ebooks, 41% bought the last book they read.
“Library lending encourages people to experiment with new authors, topics and genre — which is good for the entire reading and publishing ecosystem,” said Carrie Russell, director of the ALA’s Office for Information Technology Policy, in a statement.
The ALA and libraries nationwide are eager to convince publishers that libraries offer them a solution to one of their growing problems: How will readers discover new books in a world of disappearing bricks-and-mortar bookshelf space?
http://www.digitalbookworld.com/2012/new-survey-supports-that-ebook-borrowers-buy-too/?et_mid=590098&rid=233619411
Copy and Paste Drives Sharing
emarketing reporting:
Social sharing buttons may be sexier, but according to research from user engagement platform Tynt, copy and paste is the sharing method of choice 82% of the time.
The service, which offers a way for content publishers to track sharing behavior through embedded code that indicates referrals and includes site URLs when content is pasted elsewhere, reported that in October 2012, 2% of all page views across its network involved a copy and paste.
Just over half of the content copied was then shared. This could be in an email, an instant message or another social channel. In addition, about one-quarter of copy-and-pastes resulted in a search—that is, a word or phrase from the content being viewed was copied into a search bar to look for more information on the topic.
The future of the feature: Breaking out of templates to build customized reading experiences
NiemanJournalismLab reporting:
When it comes to reading long form, the web can be an ugly, distracting place. It’s the reason why services like Instapaper and Pocket (née Read It Later) exist: to strip content of its context — noisy site designs, advertisements, and other unnecessary elements. But perhaps we’re moving into a new era where more of the web is clean and readable. Maybe the future of web publications will be beautiful enough that the reading experience is more enjoyable in its natural habitat.
This is how I felt, at least, when I came across ESPN.com’s “The Long Strange Trip of Dock Ellis,” a gorgeously designed feature about the Pittsburgh Pirates pitcher who threw a no-hitter while under the influence of LSD. It’s arguably one of baseball’s most colorful tales; this take on it is certainly one of the most ambitious web designs ever attempted by a traditional media company for a single article. The piece is generously adorned with accompanying visuals — photos of Ellis, memorabilia like trading cards, pull quotes, all moving and sliding while the reader scrolls. The reading experience is very comfortable on both desktop and tablet, thanks to a larger text size and generous amounts of white space. It’s feels like an experience instead of a block of words surrounded by the detritus of the web.
But at a time when news is increasingly consumed without context — stripped down in tablet readers or on mobile devices — and when templates have taken over news web design, what’s the point of dedicating design resources to online feature layouts? Why are outlets like ESPN, Pitchfork, and The Verge investing in bespoke design for articles?...
http://www.niemanlab.org/2012/11/the-future-of-the-feature-breaking-out-of-templates-to-build-customized-reading-experiences/?utm_source=Daily+Lab+email+list&utm_campaign=58419386f4-DAILY_EMAIL&utm_medium=email
Nielsen: TV Usage Of 'TV' Continues To Erode, Mobile Is Fastest-Growing Segment
mediaonline reporting:
The amount of time Americans spend watching “TV” via a traditional television set continues to decline, according to the latest edition of Nielsen’s quarterly Cross Platform Report. While television remains the overwhelming means most people use to watch “television,” usage of the medium declined 1.7% over the past year, according to the second-quarter 2012 report. While still minuscule in total time spent watching TV, mobile phones were the fastest-growing means of watching television over the past year. All other sources were either flat (the Internet) or declined (DVD/Blu-Ray, video game platforms) in terms of TV usage.
“Most of the content from these activities was delivered to us on the TV set in a traditional manner, over broadcast, cable, satellite or telco connection, and a growing amount was delivered by Internet connection,” Nielsen states in the report, adding: “Americans also added another five hours in front of the computer screen using the Internet or watching video content and an increasing amount of time using smartphones this quarter.”
Almost as many Americans (236.5 million) watched TV on their phones during the second quarter of 2012, as watched it on a conventional TV set (283.3 million), albeit for much shorter durations. While the average American spends nearly 145 hours per month watching TV on a traditional TV, Nielsen didn’t even report the average time they spend watching on their phones. But mobile subscribers watching video on their phones -- a smaller sub-segment of about 37 million Americans -- spend an average of five hours and 20 minutes watching TV on their phones each month, an increase of 31 minutes over the second quarter of 2011.
Time spent watching TV via other connected devices -- an Internet-connected computer, DVD/Blu-Ray and video game consoles -- also declined.
http://www.mediapost.com/publications/article/187163/nielsen-tv-usage-of-tv-continues-to-erode-mobi.html?edition=53451#ixzz2CCgC4cFp
Four things the Washington Post’s new editor can do to avoid disaster
gigaom reporting:
Now that the election is over, much of the talk in Washington media circles is likely focused on the other momentous change that has taken place: namely, the appointing of a new editor for the venerable Washington Post. While Marty Baron’s appearance at the Post isn’t fraught with the same amount of tension as former BBC director Mark Thompson’s arrival as the new CEO of the New York Times, he clearly has a tough climb ahead of him — the Post‘s circulation has been crumbling, and its financial picture is fairly dismal as well, and getting worse by the day.
So what should the new editor do to try and right the ship? Put up a paywall like everyone else? Lay off a few hundred more staff to try and cut costs? Buy something shiny that can give the Post some online credibility? Here are a few things I think Baron needs to do if he is to avoid disaster:
There are arguments to be made for both: the Post is to some extent hamstrung by its past glories, including the famous Watergate scandal, and can’t seem to give up the idea that it is a national or even global player. And perhaps it shouldn’t. But the reality is that there’s probably a far better business opportunity — advertising-wise, at least — in focusing on serving local readers rather than trying to match the NYT for national and foreign reporting. The point is that the Post has to pick one, and dive headlong into that market, rather than trying to do both at the same time, because that road leads to perdition.
Commit to the anti-paywall strategy
Publisher Katharine Weymouth and CEO Don Graham have both talked openly about how they don’t believe a paywall will serve the paper or its readers, for a number of reasons — primarily because they appear to believe (as I do) that the benefits of remaining open and free outweigh the short-term financial benefits of putting up a paywall. But it’s not enough to just make the occasional comment about how this seems like a good idea: if the Post is going to get its staff on board, it needs to be shouting this philosophy from the rooftops in the same evangelical way that Guardian editor Alan Rusbridger does.
The reality is that the Post looks like the odd man out when it comes to paywalls, and the consensus that seems to be emerging — pushed by the Columbia Journalism Review, among others — is that it is going to fail because it is fiddling while Rome burns. If Graham and Weymouth believe that this isn’t the case, then they need to embrace the idea of open journalism as much as The Guardian has and double down on that strategy: release an open API, make videos about their passion for openness, launch some ambitious crowdsourcing projects, etc.
One thing the Post could do is to try and build a membership-based or “reverse paywall” approach, the kind that was suggested by its former managing editor Raju Narisetti (now at the WSJ).
Push the innovation meter to eleven...
Make “digital first” a core mandate...
Now that the election is over, much of the talk in Washington media circles is likely focused on the other momentous change that has taken place: namely, the appointing of a new editor for the venerable Washington Post. While Marty Baron’s appearance at the Post isn’t fraught with the same amount of tension as former BBC director Mark Thompson’s arrival as the new CEO of the New York Times, he clearly has a tough climb ahead of him — the Post‘s circulation has been crumbling, and its financial picture is fairly dismal as well, and getting worse by the day.
So what should the new editor do to try and right the ship? Put up a paywall like everyone else? Lay off a few hundred more staff to try and cut costs? Buy something shiny that can give the Post some online credibility? Here are a few things I think Baron needs to do if he is to avoid disaster:
Figure out what the Post wants to be
This is probably the hardest question that Baron, the former editor of the Boston Globe, is going to face — next to the ever-present paywall one, of course. As media blogger Erik Wemple notes in one of his columns about the paper (which he writes for), the Post has literally spent years debating whether it should be a regional paper for Washington and the surrounding area, or whether it should try to challenge the New York Times for the national and international market.There are arguments to be made for both: the Post is to some extent hamstrung by its past glories, including the famous Watergate scandal, and can’t seem to give up the idea that it is a national or even global player. And perhaps it shouldn’t. But the reality is that there’s probably a far better business opportunity — advertising-wise, at least — in focusing on serving local readers rather than trying to match the NYT for national and foreign reporting. The point is that the Post has to pick one, and dive headlong into that market, rather than trying to do both at the same time, because that road leads to perdition.
Commit to the anti-paywall strategy
Publisher Katharine Weymouth and CEO Don Graham have both talked openly about how they don’t believe a paywall will serve the paper or its readers, for a number of reasons — primarily because they appear to believe (as I do) that the benefits of remaining open and free outweigh the short-term financial benefits of putting up a paywall. But it’s not enough to just make the occasional comment about how this seems like a good idea: if the Post is going to get its staff on board, it needs to be shouting this philosophy from the rooftops in the same evangelical way that Guardian editor Alan Rusbridger does.
The reality is that the Post looks like the odd man out when it comes to paywalls, and the consensus that seems to be emerging — pushed by the Columbia Journalism Review, among others — is that it is going to fail because it is fiddling while Rome burns. If Graham and Weymouth believe that this isn’t the case, then they need to embrace the idea of open journalism as much as The Guardian has and double down on that strategy: release an open API, make videos about their passion for openness, launch some ambitious crowdsourcing projects, etc.
One thing the Post could do is to try and build a membership-based or “reverse paywall” approach, the kind that was suggested by its former managing editor Raju Narisetti (now at the WSJ).
Push the innovation meter to eleven...
Make “digital first” a core mandate...
The New Algorithm of Web Marketing
NYT reporting:
Publishers and broadcasters have long tried to offer advertisers the
right audience for their products. Want to sell pick-ups to people who
like sports? Buy ads at halftime during a football game. Selling luggage
or airline tickets? Buy ads in the travel section of a newspaper or Web
site.
In digital advertising, that formula is being increasingly tested by
fast-paced, algorithmic bidding systems that target individual consumers
rather than the aggregate audience publishers serve up. In the world of
“programmatic buying” technologies, context matters less than tracking
those consumers wherever they go. And that kind of buying is the reason that shoe ad follows you whether you’re on Weather.com or on a local news blog.
That shift is punishing traditional online publishers, like newspaper,
broadcast and magazine sites, who are receiving a much lower percentage
of ad dollars as marketers use programmatic buying across a much broader
canvas. Some sites, like CNN.com,
refuse to even accept advertising through programmatic buying because
they do not want to cede control over what ads will appear.
“It’s allowing advertisers to assign value to media rather than
publishers,” said Ben Winkler, the chief digital officer at OMD, an
agency in the Omnicom Media Group. Publishers, he said, “can’t control
the price, but they can control the quality of the content and the
audience on that site.”
About 10 percent of the display ads that consumers see online have been
sold through programmatic bidding channels, according to Walter Knapp,
the executive vice president of platform revenue and operations at
Federated Media, one of the world’s largest digital advertising
networks.
Advertisers like Nike, Comcast, Progressive and Procter & Gamble are
now using the programmatic buying, and luxury advertisers are starting
to follow... Wednesday, November 14, 2012
Five things The New York Times learned from its three-year hyperlocal experiment
NiemanJournalismLab reporting: With yesterday’s news that The New York Times is ending its affiliation with The Local
— a pair of hyperlocal blogs that the newspaper launched three years
ago — an experiment came to a close. And from the outset, the Times made
it clear that it thought of its dive into neighborhood coverage as just
that — an experiment, not an investment likely to generate financial
returns. As the Times’ Jim Schachter told us in 2009,
The Local would be, within the context of the Times, “barely enough to
create a ripple in a pond and not enough to be profitable.”
But nonetheless, even with expectations set low, when the Times moves, people notice — and 2009 was a boom time for interest in hyperlocal, Times or no Times. Some running home-grown hyperlocal sites — the kind more recently assembled under the Authentically Local banner — questioned whether a big institution like The New York Times would have the right mix to pull off neighborhood coverage. (Check out the comments on that 2009 post to see the back-and-forth between Schachter and West Seattle Blog’s Tracy Record.)
The Local project started with a pair of community-focused sites covering neighborhoods in Brooklyn and New Jersey. By June 2010, the Jersey version of The Local was shuttered. Months later, the Times and NYU jointly launched an East Village iteration.
The Local was billed as an open-ended project with some specific ideas in mind. Blogs would be helmed by a couple of professional New York Times reporters, but story ideas and contributions would come from the community. If all went well, it might create a platform the Times could license to other communities.
Meanwhile, the newspaper is sussing out what it learned from the experiment. “What we have been trying to figure out at the Times — and I think what lots of people in this space have been trying to fiure out — is how do you prompt communities, and can you prompt communities into the act of covering themselves in a meaningful way?”...
http://www.niemanlab.org/2012/06/five-things-the-new-york-times-learned-from-its-three-year-hyperlocal-experiment/?utm_source=Daily+Lab+email+list&utm_medium=email&utm_campaign=4e48b3c965-DAILY_EMAIL
But nonetheless, even with expectations set low, when the Times moves, people notice — and 2009 was a boom time for interest in hyperlocal, Times or no Times. Some running home-grown hyperlocal sites — the kind more recently assembled under the Authentically Local banner — questioned whether a big institution like The New York Times would have the right mix to pull off neighborhood coverage. (Check out the comments on that 2009 post to see the back-and-forth between Schachter and West Seattle Blog’s Tracy Record.)
The Local project started with a pair of community-focused sites covering neighborhoods in Brooklyn and New Jersey. By June 2010, the Jersey version of The Local was shuttered. Months later, the Times and NYU jointly launched an East Village iteration.
The Local was billed as an open-ended project with some specific ideas in mind. Blogs would be helmed by a couple of professional New York Times reporters, but story ideas and contributions would come from the community. If all went well, it might create a platform the Times could license to other communities.
“We, at least, have not figured out how to extract the professional journalist, or minimize it close to anything nearing zero”As it turned out, the Times ended up handing off editorial control to local journalism schools — CUNY along with NYU — while keeping The Local branded as a collaboration with The New York Times. The schools have now formed committees to figure out what to do now that the newspaper is exiting, and Schachter — whose own Times goodbye party is tomorrow — told me that the newspaper “is giving them time to figure it out.”
Meanwhile, the newspaper is sussing out what it learned from the experiment. “What we have been trying to figure out at the Times — and I think what lots of people in this space have been trying to fiure out — is how do you prompt communities, and can you prompt communities into the act of covering themselves in a meaningful way?”...
http://www.niemanlab.org/2012/06/five-things-the-new-york-times-learned-from-its-three-year-hyperlocal-experiment/?utm_source=Daily+Lab+email+list&utm_medium=email&utm_campaign=4e48b3c965-DAILY_EMAIL
Wednesday, November 7, 2012
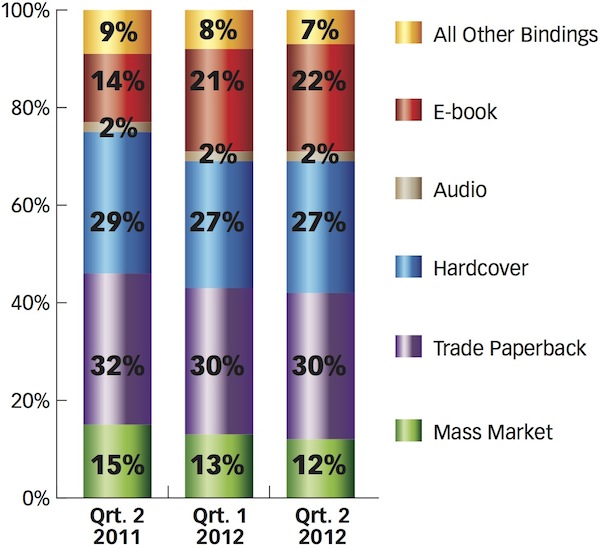
E-books Market Share at 22%, Amazon Has 27%
PW reporting:
http://publishersweekly.com/pw/by-topic/digital/retailing/article/54609-e-books-market-share-at-22-amazon-has-27.html?et_mid=588493&rid=233619411
E-books accounted for 22% of all book spending in
the second quarter of 2012, only a one percentage point gain from the
first quarter of the year, but up from 14% in the comparable period in
2011, according to new figures from Bowker Market Research. In the
year-to-year comparison, the hardcover and trade paperback segments both
lost two percentage points each to e-books, while mass market
paperbacks’ share fell from 15% in the second quarter of 2011 to 12% in
this year’s second period. (See our chart.)
With the fall of Borders and the growth of e-books, Amazon increased
its market share of consumer book spending between the second quarter
of 2011 and 2012, although its growth slowed between the first quarter
of 2012 and the second period. Still, the e-tailer was easily the
largest single channel for book purchases in the second quarter, with an
11 percentage-point lead over Barnes & Noble. B&N’s share of
unit purchases fell by two percentage points between June 2011 and June
2012, most likely due to sluggish sales of print content through BN.com.
Independent booksellers managed to hold their own in the period,
maintaining a 6% share of units.
Aside from Amazon’s increase in market
share in the June 2011–June 2012 period, the biggest channel shifts came
in the “all other” and dedicated e-book and downloadable audio sites. (See our chart.) The 21% share of other units in June 2011 reflects sales of Borders,
which had about an 8% share of the market in its last year of existence.
One of the many reasons for the failure of Borders was the growth of
e-books (and its lack of participation in that segment), and dedicated
digital sites’ share of units rose from 1% in June 2011 to 6% in June
2012.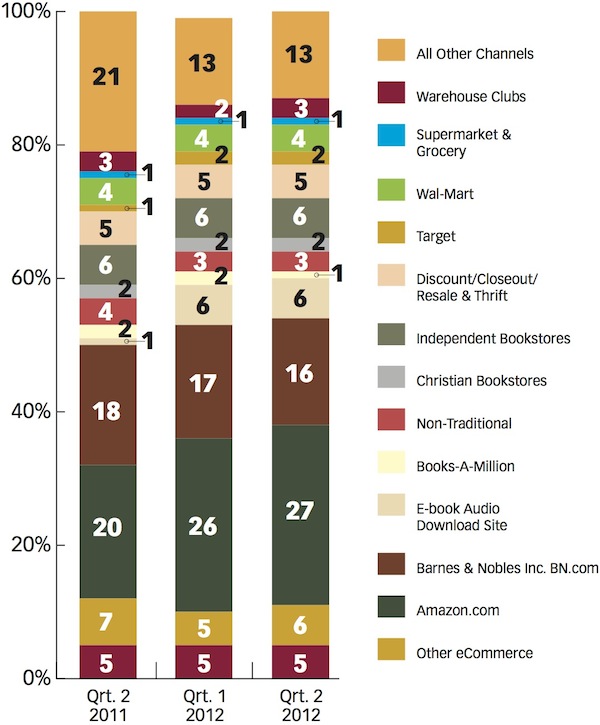
http://publishersweekly.com/pw/by-topic/digital/retailing/article/54609-e-books-market-share-at-22-amazon-has-27.html?et_mid=588493&rid=233619411
Tuesday, November 6, 2012
comScore: Kindle Fire has highest readership rates for digital magazines, newspapers
ZDNet reporting:
Tablets are "reinventing" Americans' relationship with print publications, according to a new report from digital business analytics firm comScore.
Based on new figures, more and more tablet owners in the United States are using their tablets to read digital periodicals on a daily basis. For example, comScore cited that approximately one in 10 tablet owners read digital magazines and/or newspapers on their devices everyday as of August 2012.
Mark Donovan, senior vice president of mobile at comScore, explained in the report that tablets are "redefining" how people consume news because the format is much more suited for long-form content than PCs or smartphones:
Here's a snapshot of which tablets seemed to be the most popular for a given purpose:
Tablets are "reinventing" Americans' relationship with print publications, according to a new report from digital business analytics firm comScore.
Based on new figures, more and more tablet owners in the United States are using their tablets to read digital periodicals on a daily basis. For example, comScore cited that approximately one in 10 tablet owners read digital magazines and/or newspapers on their devices everyday as of August 2012.
Mark Donovan, senior vice president of mobile at comScore, explained in the report that tablets are "redefining" how people consume news because the format is much more suited for long-form content than PCs or smartphones:
In the case of online newspapers, tablets are now driving 7 percent of total page views, an impressive figure considering the relative infancy of the tablet space. Publishers that understand how these devices are shifting consumption dynamics will be best positioned to leverage this platform to not only drive incremental engagement among current subscribers but also attract new readers.But which devices they are using tends to factor in to which kinds of periodicals they are reading, how often they are reading and for the length of each reading session.
Here's a snapshot of which tablets seemed to be the most popular for a given purpose:
- Kindle Fire: Highest readership rate for digital magazines at 43.9 percent and newspapers at 39.2 percent
- Nook Tablet:
- http://www.zdnet.com/comscore-kindle-fire-has-highest-readership-rates-for-digital-magazines-newspapers-7000005937/
'Native' ads disrupt the digital advertising model
emedia/vitals reporting:
Are advertorials really the new black? It appears that way, as publishers embrace “native” advertising formats that put a digital spin on print advertorials and “special advertising sections.”
The native advertising push has been driven by social media, with Facebook pioneering sponsored stories and Twitter offering sponsored tweets as advertising vehicles that integrate with the content streams of those respective platforms. Digital publishers are now embracing the concept for their own web properties, offering native programs that integrate advertising and editorial. Their goal is to sell more of these premium programs to prevent digital advertising from devolving into a cesspool of low-CPM, programmatic buying.
Questions remain, however, about the effectiveness of sponsored stories, branded content or other attempts to commingle marketing messages with editorial content. Proponents call it “providing a consistent user experience.” Detractors say it blurs traditional church and state lines between editorial and advertising.
Worse, ads-as-content might actually damage brands. Survey results released today by MediaBrix show that the majority of online adults find native advertising – in any medium – to be misleading. Specifically, 45% found Twitter’s promoted tweets misleading, 57% found Facebook’s sponsored stories misleading, 66% found advertorials misleading, and 86% objected to sponsored video ads that appear to be content. The majority also said these types of ads negatively impacted or had no impact on their perception of the brand being advertised.
http://www.emediavitals.com/content/native-ads-disrupt-digital-advertising-model?utm_source=Daily+Buzz+from+eMedia+Vitals&utm_campaign=f719147509-nl_DB_11_06_2012&utm_medium=email
The Cross-Platform Report: How and Where Content is Watched S
Nilesen Wire reporting:
According to the latest Nielsen Cross-Platform Report, Americans spend nearly 35 hours per week watching video across screens, and close to another five hours using the Internet on a computer. Consumers are not turning off their devices, and there is no doubt that they are faced with more choices in terms of how they watch video content. Shifts in the distribution of time spent across all screens and devices demonstrate that more consumers are taking advantage of their increased ability to determine what, how and where they view content.

According to the latest Nielsen Cross-Platform Report, Americans spend nearly 35 hours per week watching video across screens, and close to another five hours using the Internet on a computer. Consumers are not turning off their devices, and there is no doubt that they are faced with more choices in terms of how they watch video content. Shifts in the distribution of time spent across all screens and devices demonstrate that more consumers are taking advantage of their increased ability to determine what, how and where they view content.
Gaming consoles are not just for gamers...
Apple’s Tablet Market Share Drops to 50.4%
Mashable reporting:
Apple‘s tablet market share has dropped to 50.4% in Q3 2012, down from 59.7% in the same period last year, IDC’s latest report reveals.
Samsung, on the other hand, has experienced huge growth, jumping from 6.5% to 18.4% in that same period. Amazon holds the third place with 9%, followed by Asus with 8.6% and Lenovo with 1.4%.
The old Silicon Valley joke, which claimed that “there is no tablet market, only an iPad market,” is obviously no longer true. According to IDC’s numbers, Samsung shipped 5.1 million tablets worldwide in 3Q12, up 115% from 2Q12 and 325% from 3Q11.

Things are looking very good for Amazon, also, whose rapidly
expanding Kindle Fire lineup has helped it double its market share
quarter-over-quarter.
http://mashable.com/2012/11/05/apples-tablet-market-share-drops-to-50-4-percent-report/
Apple‘s tablet market share has dropped to 50.4% in Q3 2012, down from 59.7% in the same period last year, IDC’s latest report reveals.
Samsung, on the other hand, has experienced huge growth, jumping from 6.5% to 18.4% in that same period. Amazon holds the third place with 9%, followed by Asus with 8.6% and Lenovo with 1.4%.
The old Silicon Valley joke, which claimed that “there is no tablet market, only an iPad market,” is obviously no longer true. According to IDC’s numbers, Samsung shipped 5.1 million tablets worldwide in 3Q12, up 115% from 2Q12 and 325% from 3Q11.
http://mashable.com/2012/11/05/apples-tablet-market-share-drops-to-50-4-percent-report/
Friday, November 2, 2012
How HTML5 Based Books will Disrupt the Digital Publishing Sector
goodEreader reporting:
Many digital publishing companies are increasingly looking to iOS and Google Android to make standalone apps for their eBooks or digital properties. They also deal with the traditional eBook format that is available via online retailers like Amazon, Barnes and Noble and Kobo. Dedicated app development geared towards a singular platform normally warrants an extensive programing department to generally refine the apps over time and add new content. Digital Publishers and Online retailers all make apps to garner customers dollars and offer distribution systems to push sales to the end user. HTML5 seeks to disrupt the current model everyone is employing to the entire Digital Publishing Industry.
Last year Google released the source code for their browser based ebook “20 things I learned about Browsers and the Web” It features a very solid animated book, complete with turn page animations. Most of the content is highly interactive and publishers can easily insert a picture and the text will conform to where you are dragging it within the book. It revolutionized the way that electronic books are accessible via a multitude of web browsers. Instead of making a dedicated app, they made it available to be read on tablets, iPhones, computers and every other mobile device.
Amazon and Kobo have already taken advantage of HTML5, by opening their Kindle Cloud Reader and Kobo Reader. These were initially designed and made available to buy, purchase and read books on the iPad and iPhones. Apple had implemented a policy last year that demanded all in-app purchases be made by iTunes. This resulted in these two companies disabling the functionality to buy electronic content in the app. They bypassed this by developed a fully featured HTML5 based store app, that functioned like their iOS or Android equivalents...
One of the most highly contested debates these days is between books that are encrypted via Digital Rights Management and books that are free to share. We also see many different ebook formats like AZW, EPUB, PRC, PDF, TXT, RTF, CBR, CBZ and many more. This confuses the average user who just wants to buy a book on their Kindle and read it later on their Nook or on their PC.As it stands, you can’t read books purchased from Amazon on any other device. If you want to buy a book from Barnes and Noble and read it on your Kobo, you need to use complicated software like Adobe Digital Editions. Selling the HTML5 based version and using the e-Reader, Tablet and any PC’s web browser would give you a fuller experience and cut down on the manual work customers have to do, just to enjoy their book. This would seriously disrupt the conventional way that people use different ebook formats...
http://goodereader.com/blog/electronic-readers/how-html5-based-books-will-disrupt-the-digital-publishing-sector/
Children’s Ebooks up 89% in July, Adult up 48%
dwb reporting:
Growth in children’s ebook publishing revenues in the U.S. showed signs of slowing from a stupendous rate earlier in the year, perhaps affected by the Hunger Games ebook sales tapering off. Adult trade ebook growth in July was in line with figures from the rest of the year which show a steep drop-off from triple-digit growth rates of the past few years, according to new figures from the Association of American Publishers.
Children’s ebooks grew by 89% in July 2012 versus the same period last year — a fast growth rate, to be sure, but much slower than in early 2012 when children’s ebooks saw monthly growth rates of 475.1% in January and 177.8% in February.
The slowdown is likely due to tapering sales for Scholastic’s smash hit The Hunger Games...
Meanwhile, adult ebook sales were up 48% in July versus the same period last year. From 2007 through 2011, e-book sales doubled or more every year. This year, ebook growth has slowed to a still-breakneck speed of about 30% to 50%. According to Publishers Lunch, ebook revenues are at about 26% of overall trade publishing revenues...http://www.digitalbookworld.com/2012/childrens-ebooks-up-89-in-july-adult-up-48/
Subscribe to:
Posts (Atom)